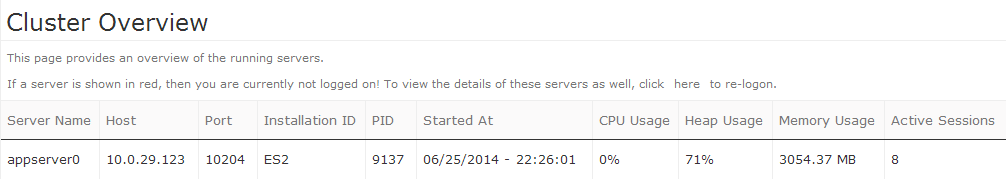
Select Monitoring from the Intershop System Management navigation bar.
This opens the Cluster Overview page, which lists all servers in the cluster and displays basic performance data.Figure 1. Cluster overview page
Monitoring Sub-Modules
The Monitoring section in the navigation bar comprises the following sub-modules, each providing the corresponding detailed information:
Application Server
Java VM
OR Mapping
JDBC
Cartridges
Performance
Background
Database Status
Locking
Services
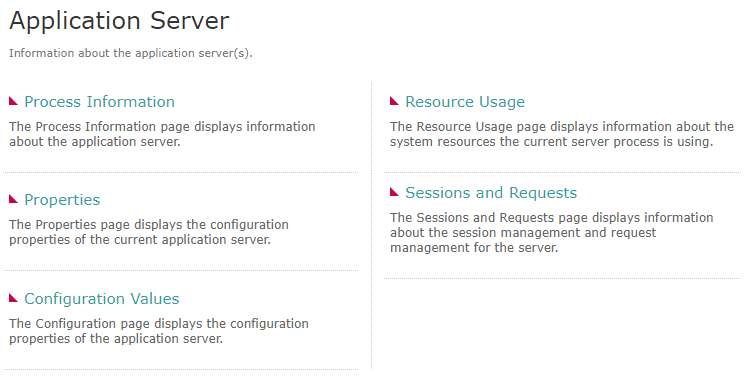
Sub-Module Overview Page
By clicking one of the sub-modules, you are taken to an overview page that lists the available monitoring options.Figure 2. Example - Sub-Module overview page 'Application Server'
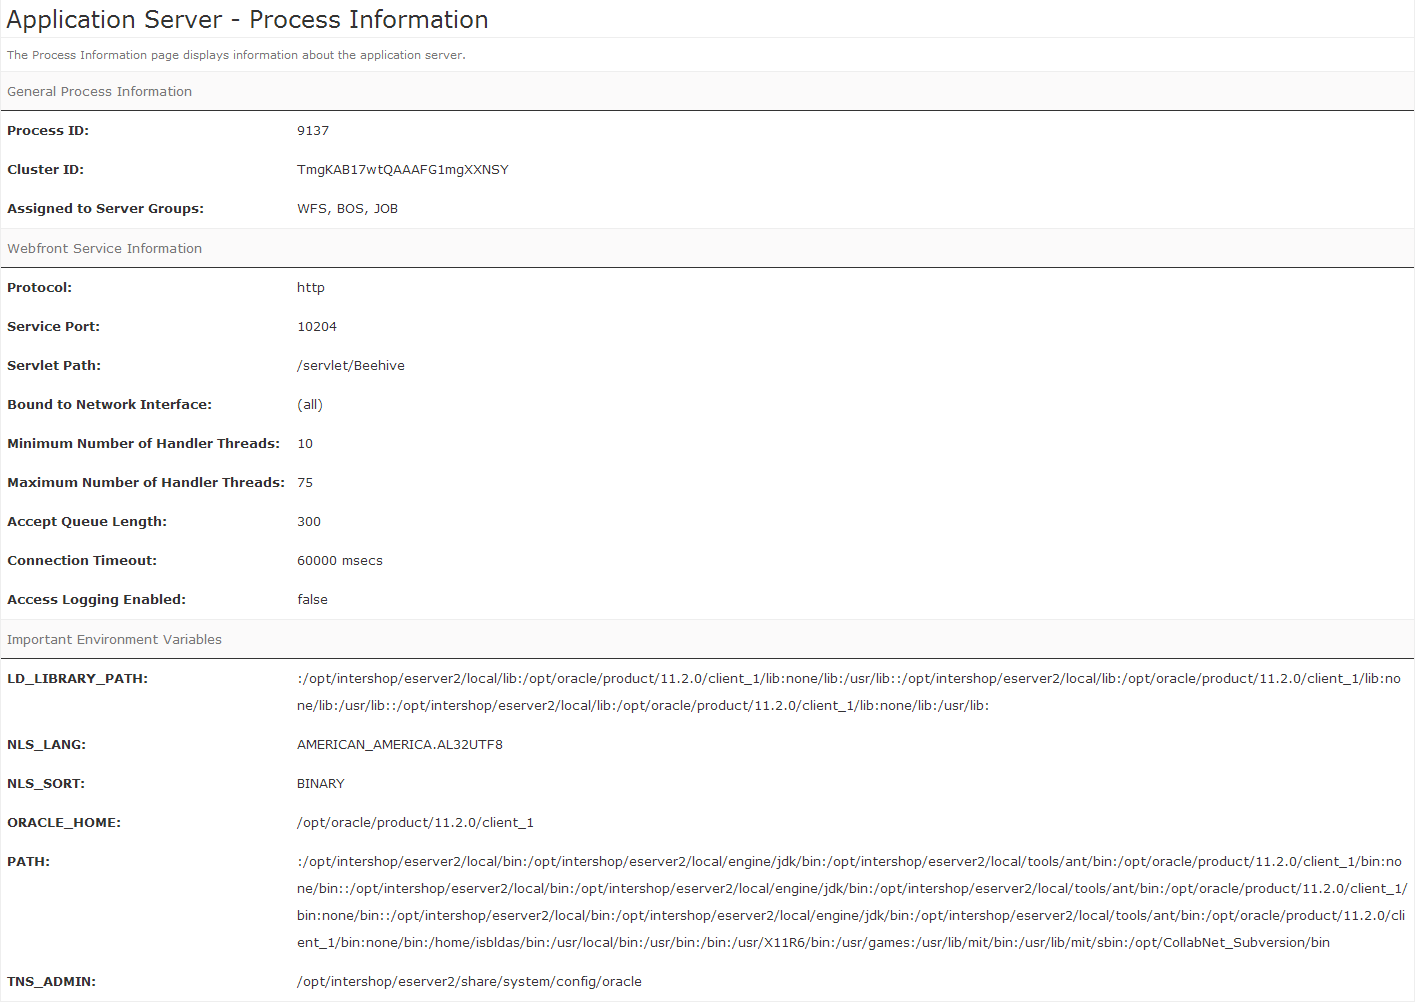
Sub-Module Detail Page
To view the detailed information of a topic listed in the sub-module overview page, click the corresponding link, e.g., Application Server. This opens the detail view.Figure 3. Example - Sub-module detail page - 'Application Server - Process Information'
Disclaimer
The information provided in the Knowledge Base may not be applicable to all systems and situations. Intershop Communications
will not be liable to any party for any direct or indirect damages resulting from the use of the Customer Support section
of the Intershop Corporate Website, including, without limitation, any lost profits, business interruption, loss of programs
or other data on your information handling system.